New Titanium Plate Study Maps Backside Defects From a Surface Sound Signal
A peer-reviewed paper published on 2026-08-25 reports a non-contact way to locate defects hidden on the back of a titanium plate. The proposed sensor excites the plate with electromagnetic force and measures the resulting sound pressure above the accessible surface. Experiments showed a stronger response near the hidden defect, while 3D-FEM analysis linked that signal to increased surface vibration displacement in the same area (research paper).
That is a useful inspection result, but it is not yet a production release rule. The durable buyer lesson is narrower: a defect indication becomes transferable only when the complete chain from excitation to vibration, sound, location and confirmation remains controlled.
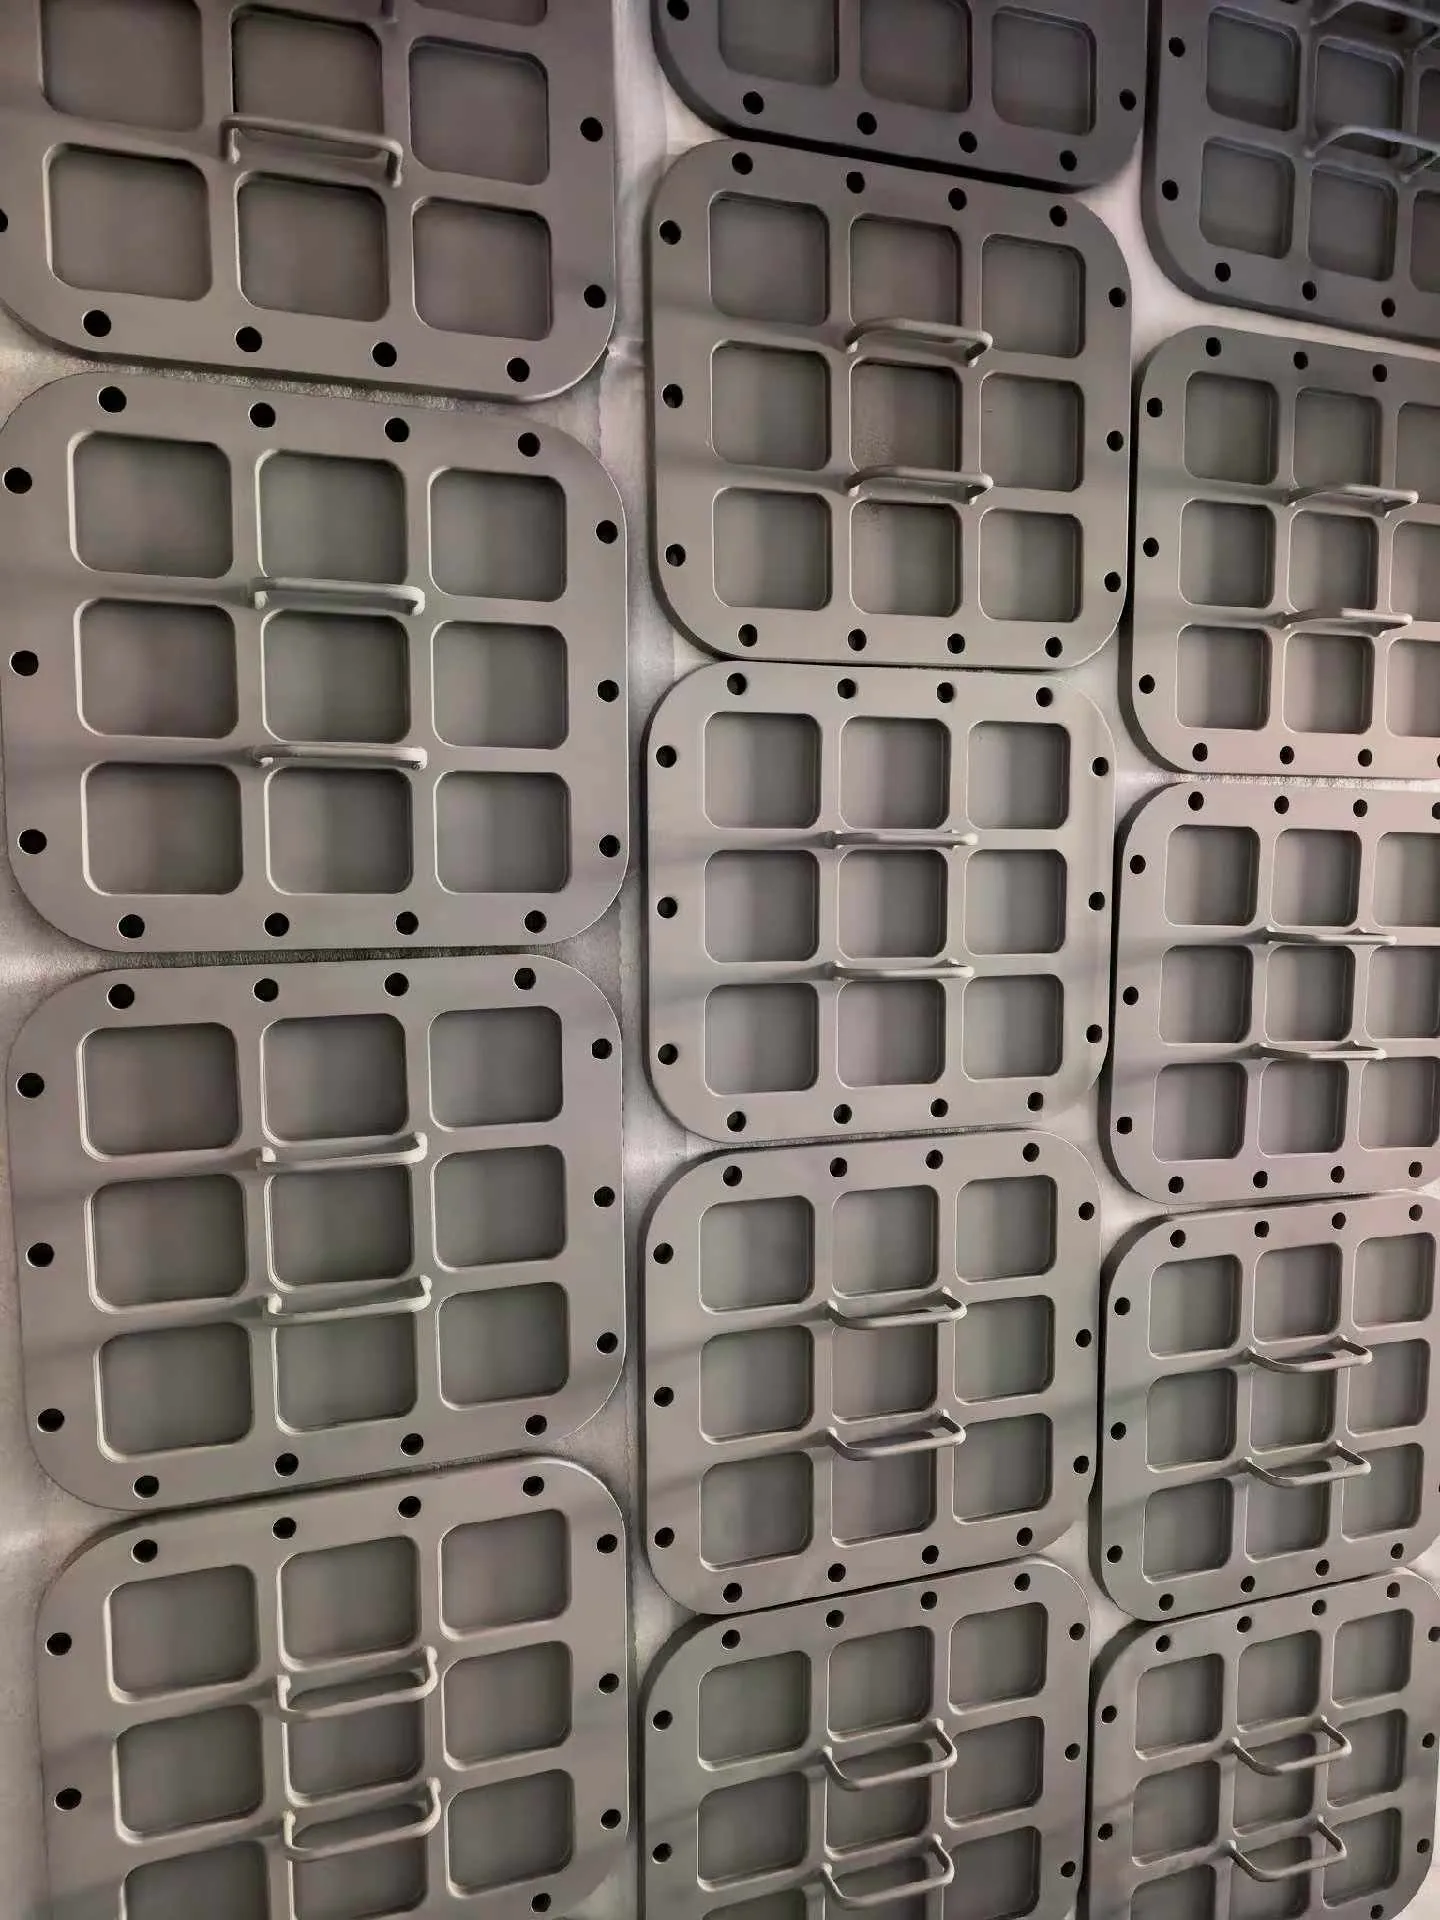
The defect changes a field before the sensor reports a peak
Backside defects are awkward because the damaged side may be inaccessible. The new work approaches the problem from the opposite face. Electromagnetic force induces vibration in the plate. A hidden discontinuity changes local stiffness and motion, so the surface vibration displacement rises near the defect. The sensor does not see the cavity directly; it reads the sound-pressure consequence of that altered vibration field.
This distinction matters. “The sound got louder” is an observation. “A controlled electromagnetic input created a repeatable vibration-field change at a defect location” is a mechanism. Only the second form tells an engineer what must remain stable when plate thickness, alloy state, edge distance, defect geometry, lift-off or scan spacing changes.
The authors combined experiments with a three-dimensional finite-element analysis. That pairing improves the causal explanation, but a model remains dependent on its boundary conditions. A calculated displacement field cannot by itself establish detection reliability across every plate family or service defect.
A location map is not the same as an acceptance decision
The deposited abstract says the proposed sensor identified backside-defect locations by a 2D measurement of surface vibration intensity. It does not provide, in the accessible record, a probability-of-detection curve, false-call rate, defect-size threshold, full material-and-thickness range or production acceptance standard.
Those missing items are not editorial footnotes. They separate three different claims:
- a physical signal changes near a known defect;
- a scan can locate that defect under the reported setup; and
- a qualified process can accept or reject commercial plate with a controlled error rate.
The paper supports the first two within its reported study. The third requires more evidence. A buyer should therefore treat the method as a promising inspection pathway, not as an automatic replacement for an approved NDT route such as ultrasonic testing.
Scan geometry belongs in the method, not in an operator note
Non-contact inspection sounds less sensitive to setup because the sensor does not touch the plate. In reality, removing contact creates other variables. Excitation position, sensor standoff, angle, scan pitch, edge distance, restraint and ambient acoustic conditions can all shape the response. Plate thickness and elastic state can move resonances or redistribute vibration.
That makes geometry part of the evidence. A result from one flat coupon cannot be transferred to a larger plate, cut blank or formed panel using only the same equipment name. The transfer file must show which variables were held fixed, which were normalized and which trigger a new validation.
For suppliers of titanium sheets and plates, the commercial value is not a novel sensor on a capability list. It is a defensible connection between plate identity, scan setup, indication coordinates and the downstream release record.
A six-line signal-to-release evidence map
| Control line | What must be defined | Evidence before release |
|---|---|---|
| Plate boundary | Alloy state, thickness, dimensions, surface condition, restraint and edges | Qualified family and documented exclusions |
| Defect target | Location, orientation, depth, projected size and relevant production mechanism | Reference defects tied to the intended inspection claim |
| Excitation | Source geometry, frequency or sweep, drive level and position | Controlled input plus equipment verification |
| Sensing and scan | Standoff, angle, grid spacing, acquisition bandwidth and environmental control | Repeatable scan plan and raw-data retention |
| Decision performance | Signal feature, threshold, spatial error, repeatability and false calls | Blind trials, detection statistics and confirmation by an approved method |
| Transfer and change | New thickness, geometry, fixture, software, sensor or defect population | Written revalidation triggers and release ownership |
This map prevents a common shortcut: using a visible peak as though it were a calibrated defect size. A peak may locate an anomaly without classifying it, sizing it or proving its service relevance. Confirmation can still require ultrasonic, radiographic, penetrant or destructive evidence depending on the defect and specification.
The framework also helps evaluate automation. A dense scan may generate an attractive heat map, yet software smoothing can move or suppress a local maximum. Versioned processing settings, raw signal retention and traceable coordinates matter as much as the visual output.
The restrained conclusion is about evidence maturity
The study adds a credible mechanism for finding an inaccessible plate-side defect from the opposite surface. Its strength is the connection between experiment and a modeled vibration field. Its limit is equally clear: the accessible source does not establish a universal production procedure or acceptance threshold.
For procurement and quality teams, the next question is not “Can the sensor see a defect?” It is “Which plate family, defect population and scan conditions have been validated, against what reference, with what error boundary?” That question turns an interesting signal into an auditable inspection decision without claiming more than the paper demonstrates.
FAQ
# What did the new titanium plate study demonstrate?
# Why did sound pressure rise near a backside defect?
# Does the paper qualify a production NDT method?
# What should a titanium plate buyer request before release?
Need this material? Get a factory-direct quote.